I did a twitter thread yesterday on analyzing Nigerian stocks. Thought to put it together as an article.
There’s not much difference between analyzing stocks on the ngx and anywhere in the world. You just have bigger and more complex firm’s elsewhere.
There are two ways you approach stocks. Top to bottom. Or bottom to top
Top to bottom
Top to bottom means you start with analyzing the country as a whole. You look at gdp which measure economic growth. What sectors are doing well or not. What sectors are doing poorly. Any swings in the fx rate. Who wins or loses ?
Is inflation accelerating or slowing. Who gains or losses.
After you have done this, you can then look at firms operating in the various players that you think are either going to benefit or losing. You can play things either way.
Let’s take the devaluation of the Naira. Banks broadly made gains though the windfall tax will take a chunk of that. Had dollar assets which become worth more in Naira terms. Agri players dollar revenue same translation effects.
On the flip side, manufacturers and other firms with dollar debt translated to Naira had more liabilities. Input cost went up for them.
So one could play the game either way. Then pick individual stocks to look at.
Bottom to top
If you start with a bottom to top approach, you start with examining individual companies, then you pick one.
Financial statements
There are 3 financial statements you can need to look at. These statements are released as a singular document quarterly. Then at the end of the company’s financial year after it has been audited.
- Income statement
- Balance sheet
- Cash flow statement
Income statement
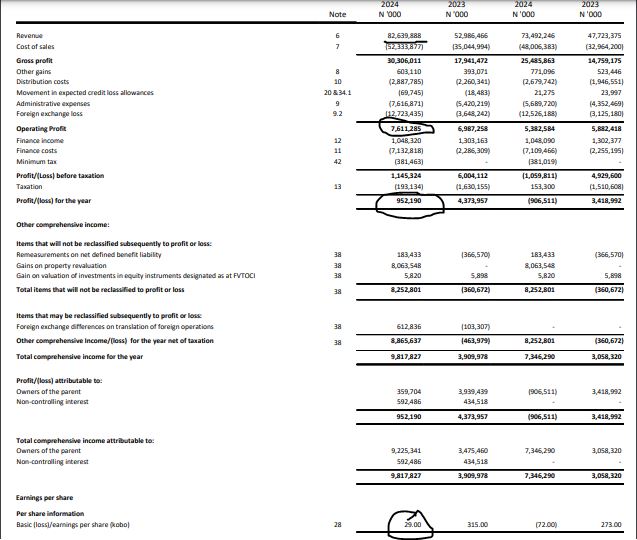
The Income statement gives you an overview of a company’s revenue and expenses over time.
Below is the audited FY 2024 income statement for Vitafoam Plc

Balance sheet
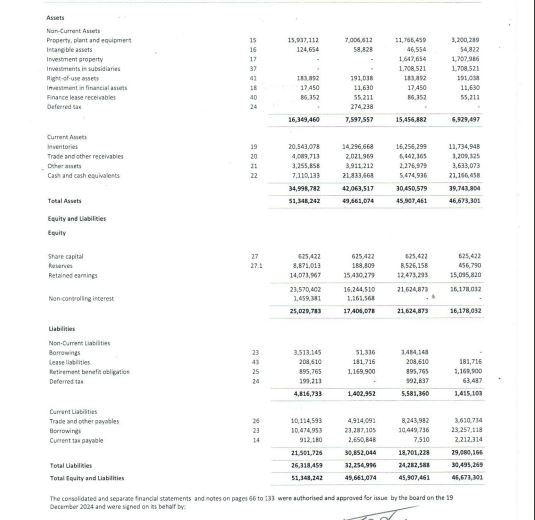
A balance sheet looks at the assets and liabilities owned by a firm. Assets are things a company owns. Liabilities are debt/money owed by a company.
You want to see the company having more assets than liabilities.
Below is Vitafoam’s balance sheet

Cash flow statement
The cash flow statement shows you inflow and outflow of cash over a period. This is important because dividends can only be paid from cash.

Brian Feroldi does an amazing job breaking financial statements.
Bottom to top
In bottom to up, you start with companies in an industry. Go through each one, and then pick a few based on their strengths and weaknesses.
So let’s go to the bottom. Let’s say you decide to go with the winners.
Every industry has metrics you use. I’d focus on those I am familiar with it.
What to look for in a banking stock?
I like to look at the revenue split. You have 3 headers corporate banking. Investment banking. Retail. You can also split between interest and non interest revenue.
If there are operations outside naija, you can look at how they’re doing.
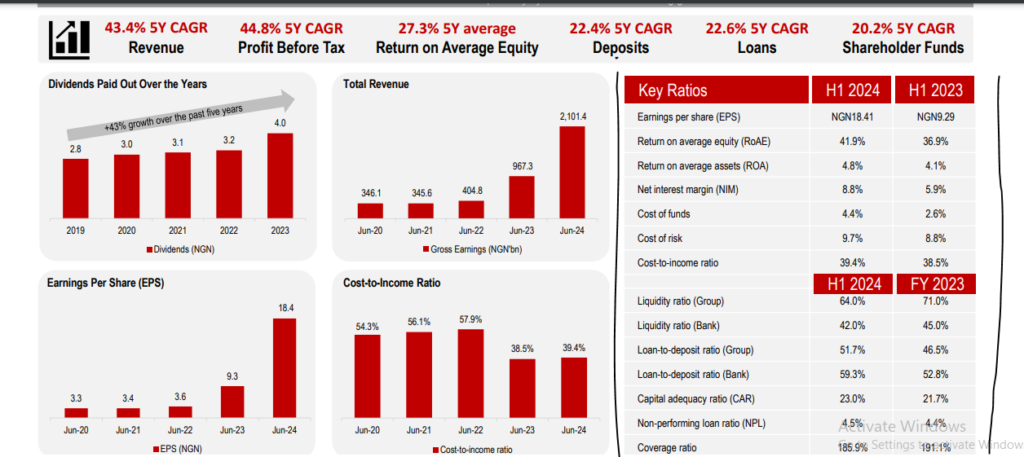
You have the cost to income ratio. What proportion of income goes to cost.
Then you look at the proportion of non performing loan to total loans. You have pectoral split.
You have the CASA (current account and savings account) ratio. The CASA ratio is the proportion of deposit in savings and current compared to total deposits. The higher the CASA ratio, the better.
Net interest margin (commonly known as NIM) measures the difference between the interest income and interest expense. The higher the NIM the better
Here is a snapshot of various key metrics from Zenith Bank’s H1 2024 presentation.

Telcos
For telcos the metrics are different.
You have data revenue and voice revenue. Both are collectively known as service revenue. Other revenue such as fintech. How well are they growing? Which has the lion share?

You have ARPU which means average revenue per user . Average revenue per user. That can be split between voice and data arpu.
You also look at data consumption where available. Average data used by 3g. 4g. 5g if e dey.
Mobile money is a small part of the pie. If you get the colour there fine.
Lastly for telcos. Capital expenditure. How much and where is it going to.
Oil and gas (upstream)
Upstream means exploration and production of oil and gas.
You look at production cost per barrel. Global prices because its a global commodity.
Is there any down time. Is it due to infrastructure issues or specific to the firm.
Capital expenditure (capex) is key too. How much? How many Wells are being drilled.
Agricultural firms.
You look at volumes produced. Domestic sales. Export
Fast moving consumer goods (FMCGs)
In analyzing companies in the fast moving consumer goods space, the metrics to consider include quantity of good sold, inventory levels (finished goods and raw materials). Others are the quantity of receivables (money owed) and payables (the amount a company owes creditors and suppliers).
A lot of this information is broken down in simple forms in earnings releases and investor presentation. You also have earnings calls. management shares their view on the economy and specific industry. People get to ask questions.
The investor relations segment in the company’s website should have all this info. You can also email them.

Leave a Reply